Topological Data Analysis Augments Classical Methods Revealing Rich Structures in Data
Simple Illustrative Example: Analyze Web Traffic Data to a Wikipedia Page
Exploring Web Traffic Data with 7 images
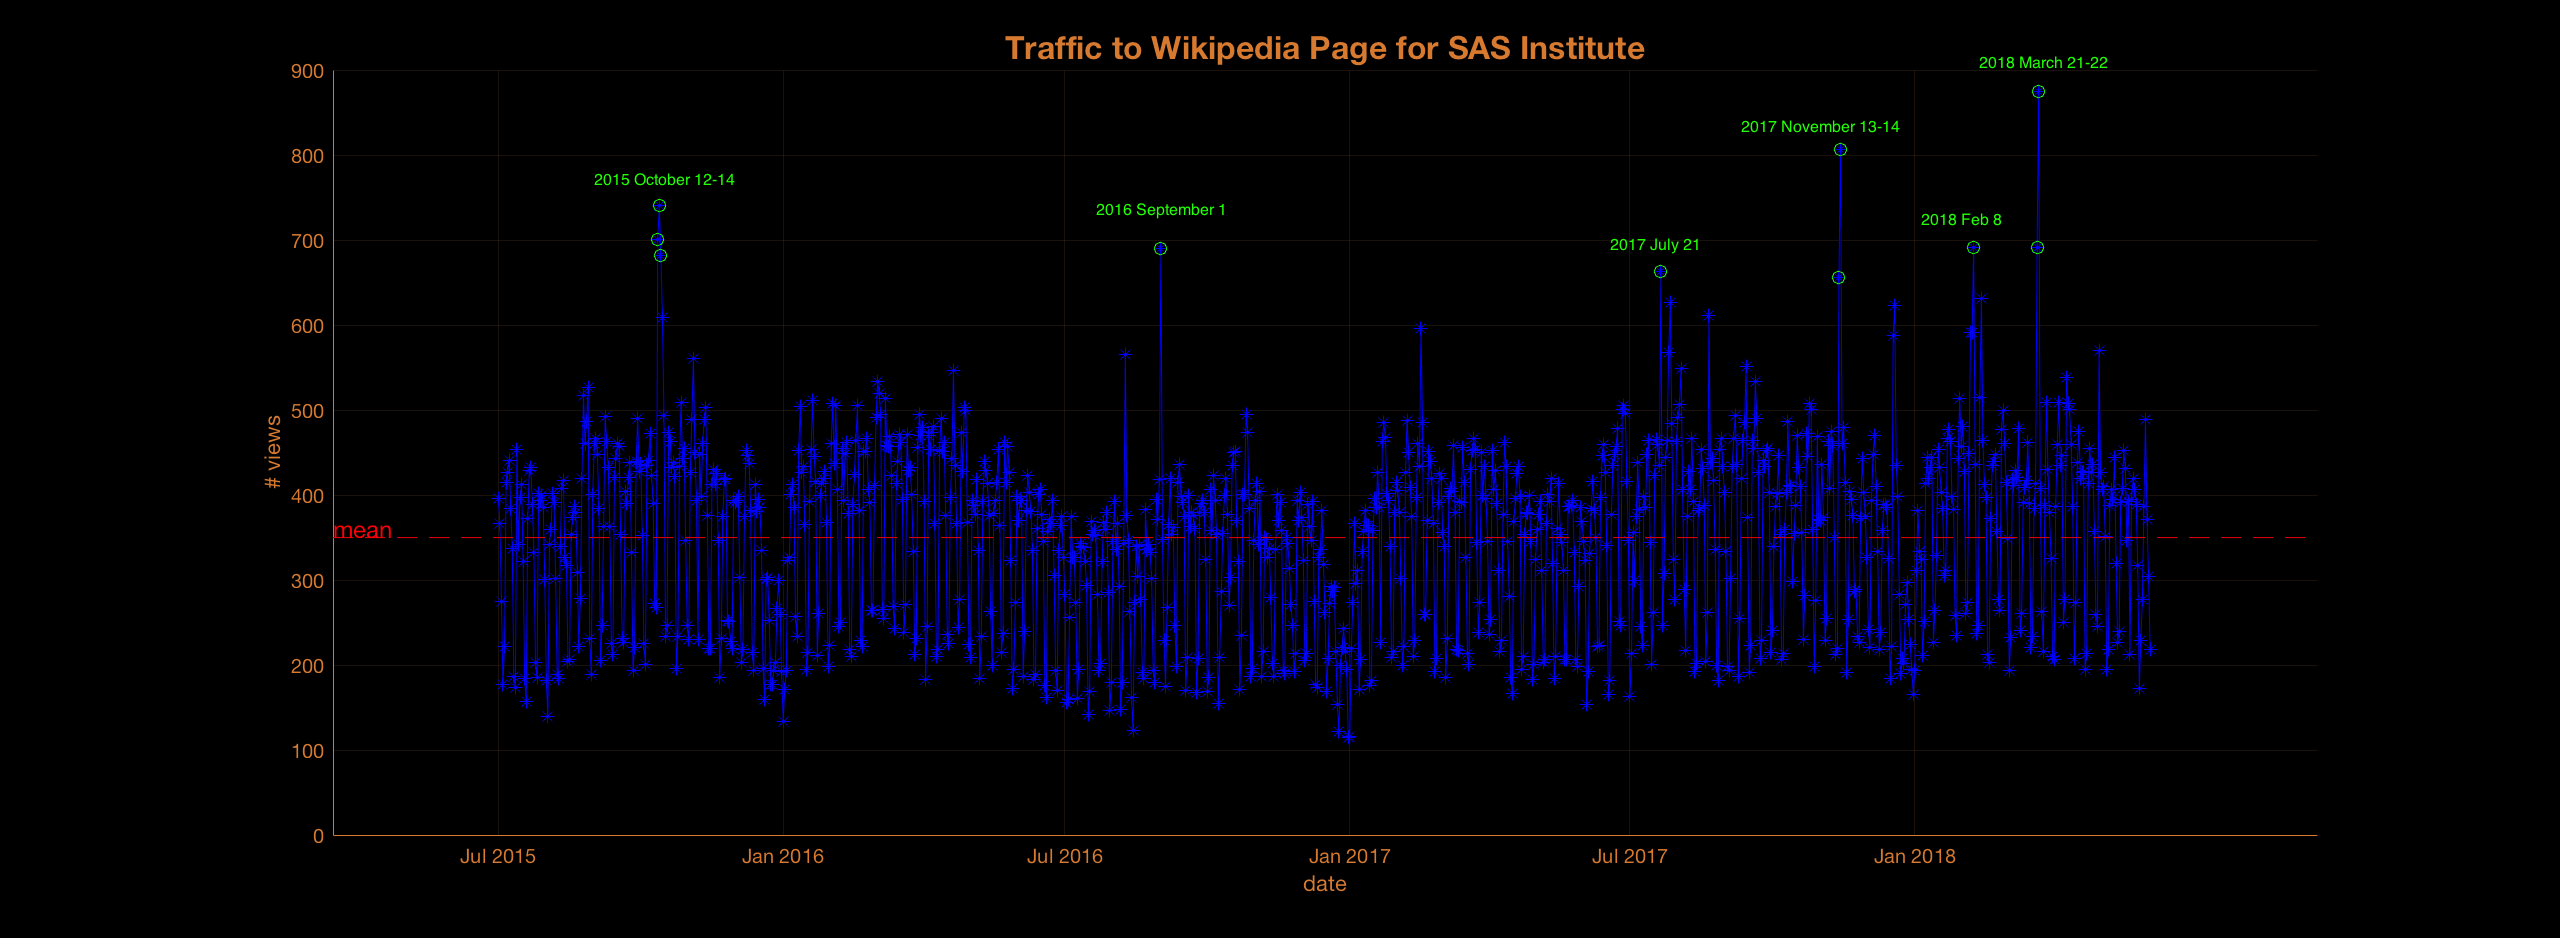
Plotting the time series reveals some interesting outliers. What was special about those particular dates?
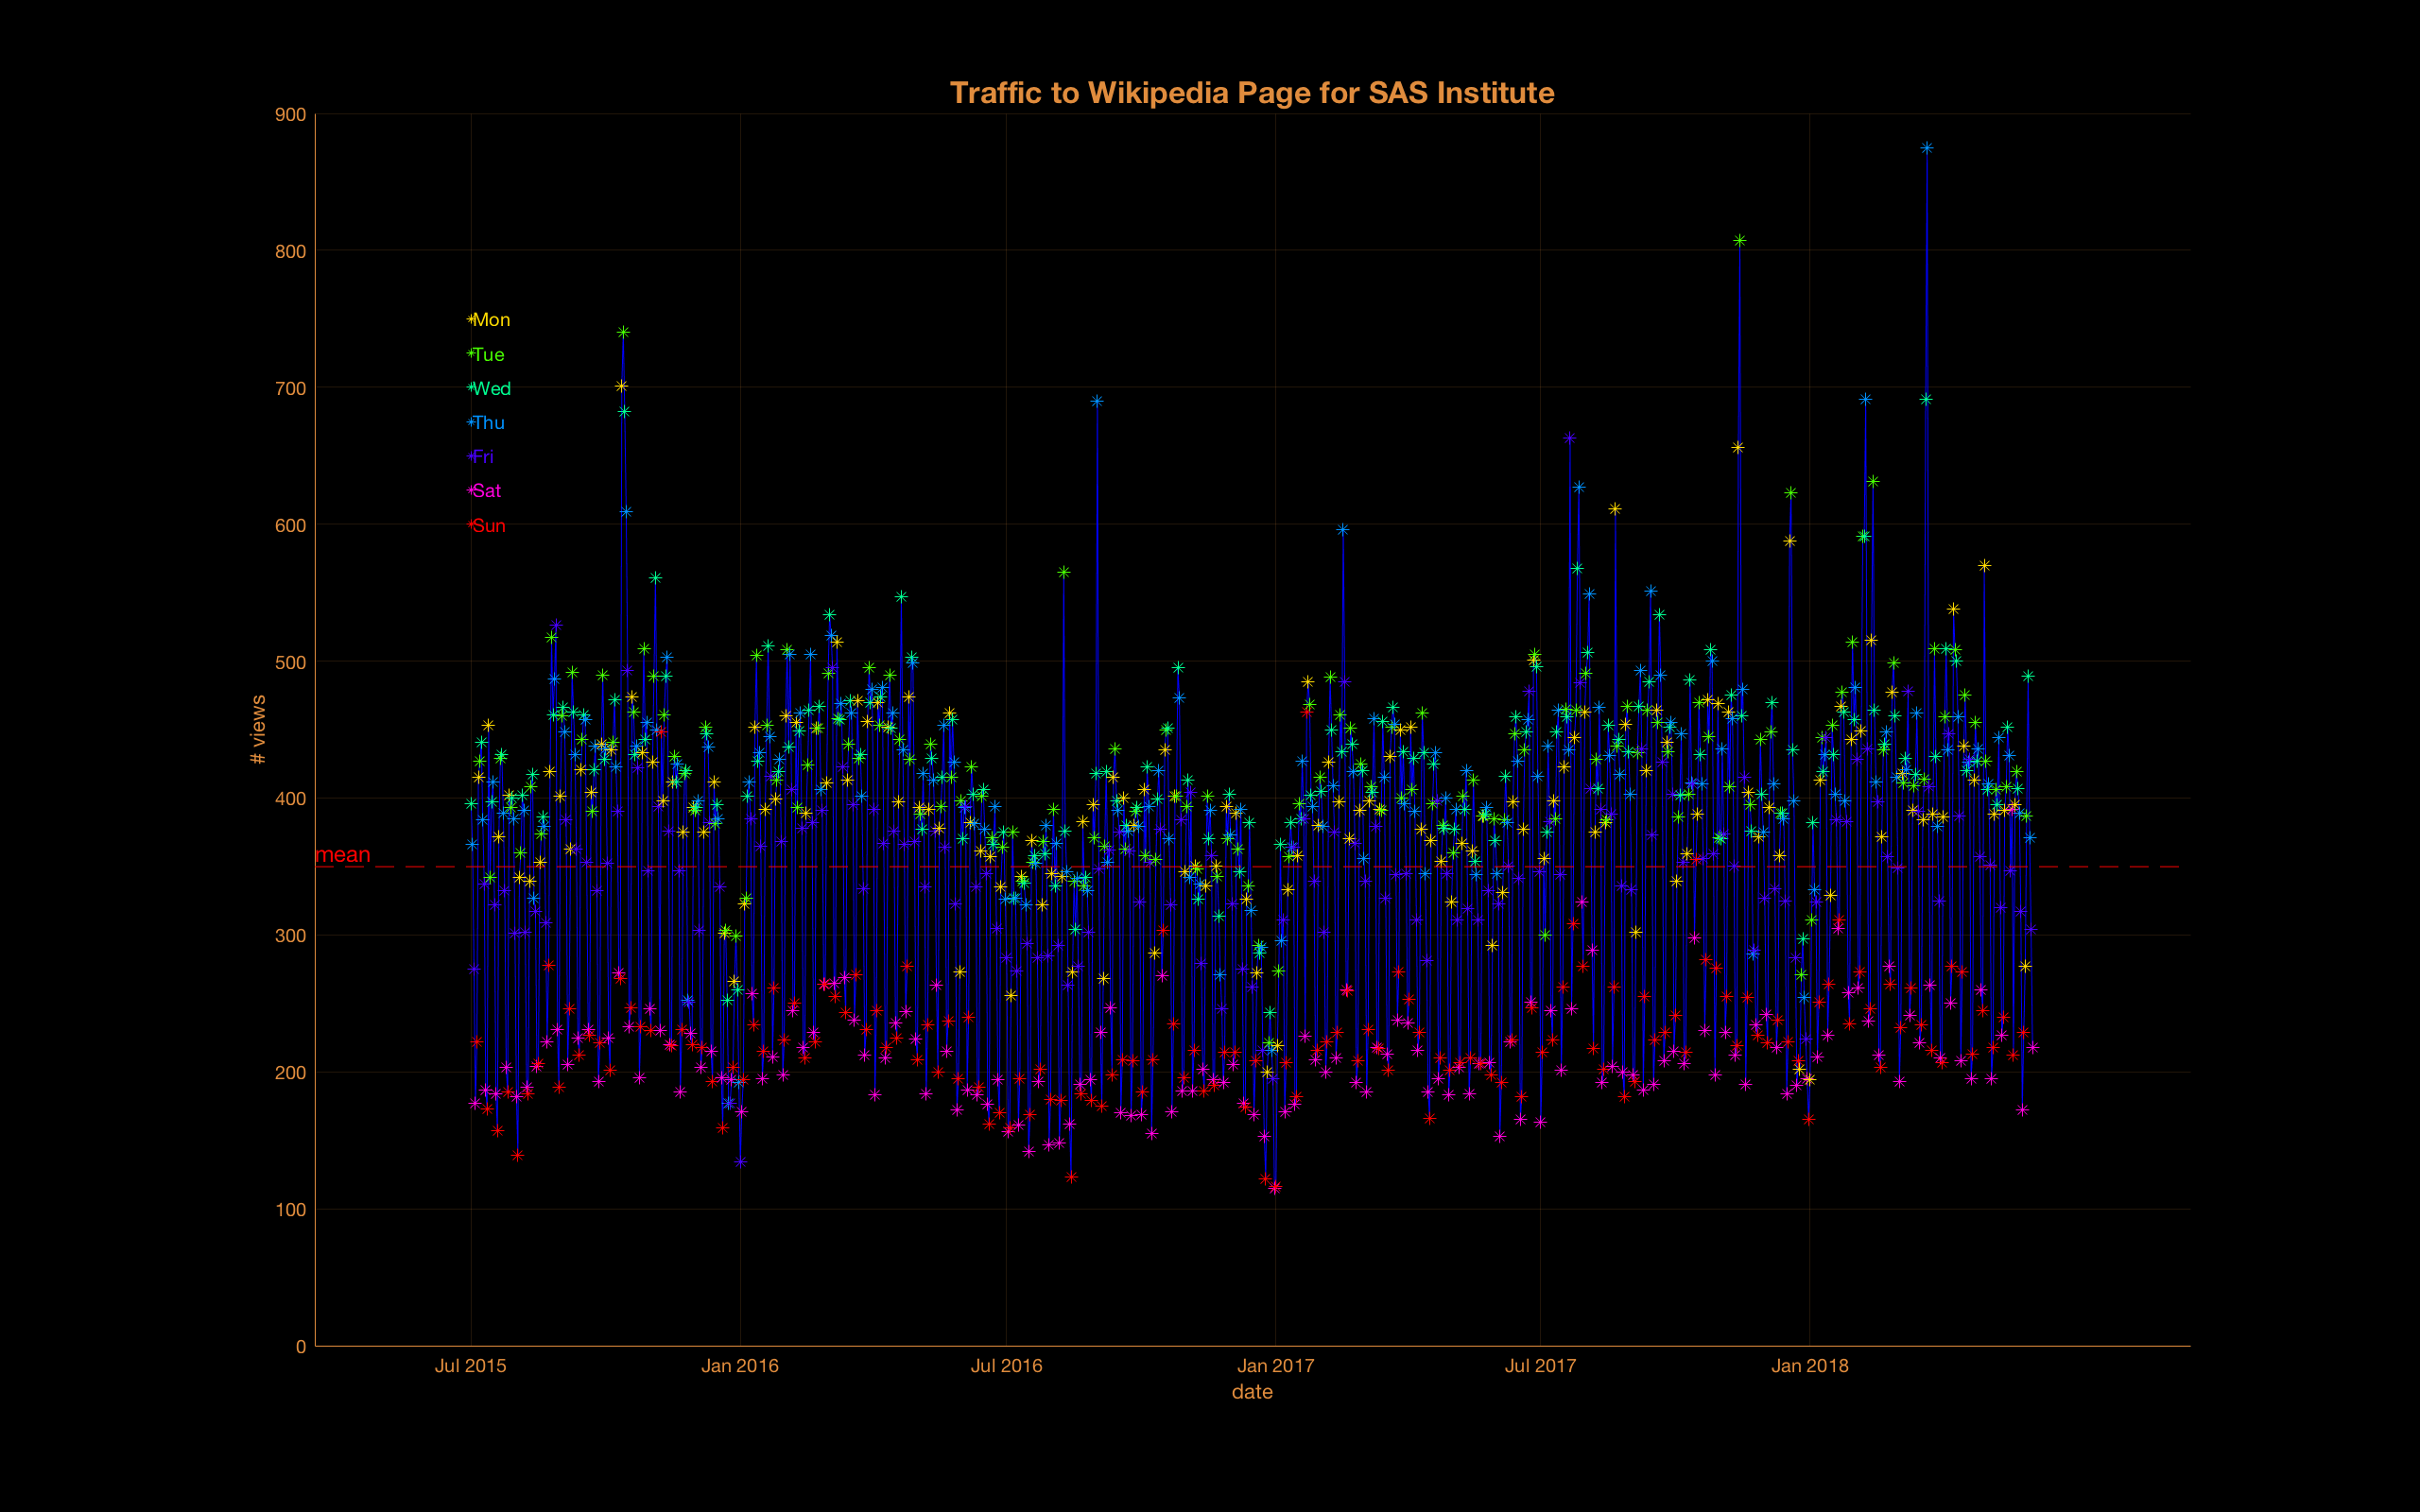
Adding color to the days of the week reveals lower traffic on weekends.
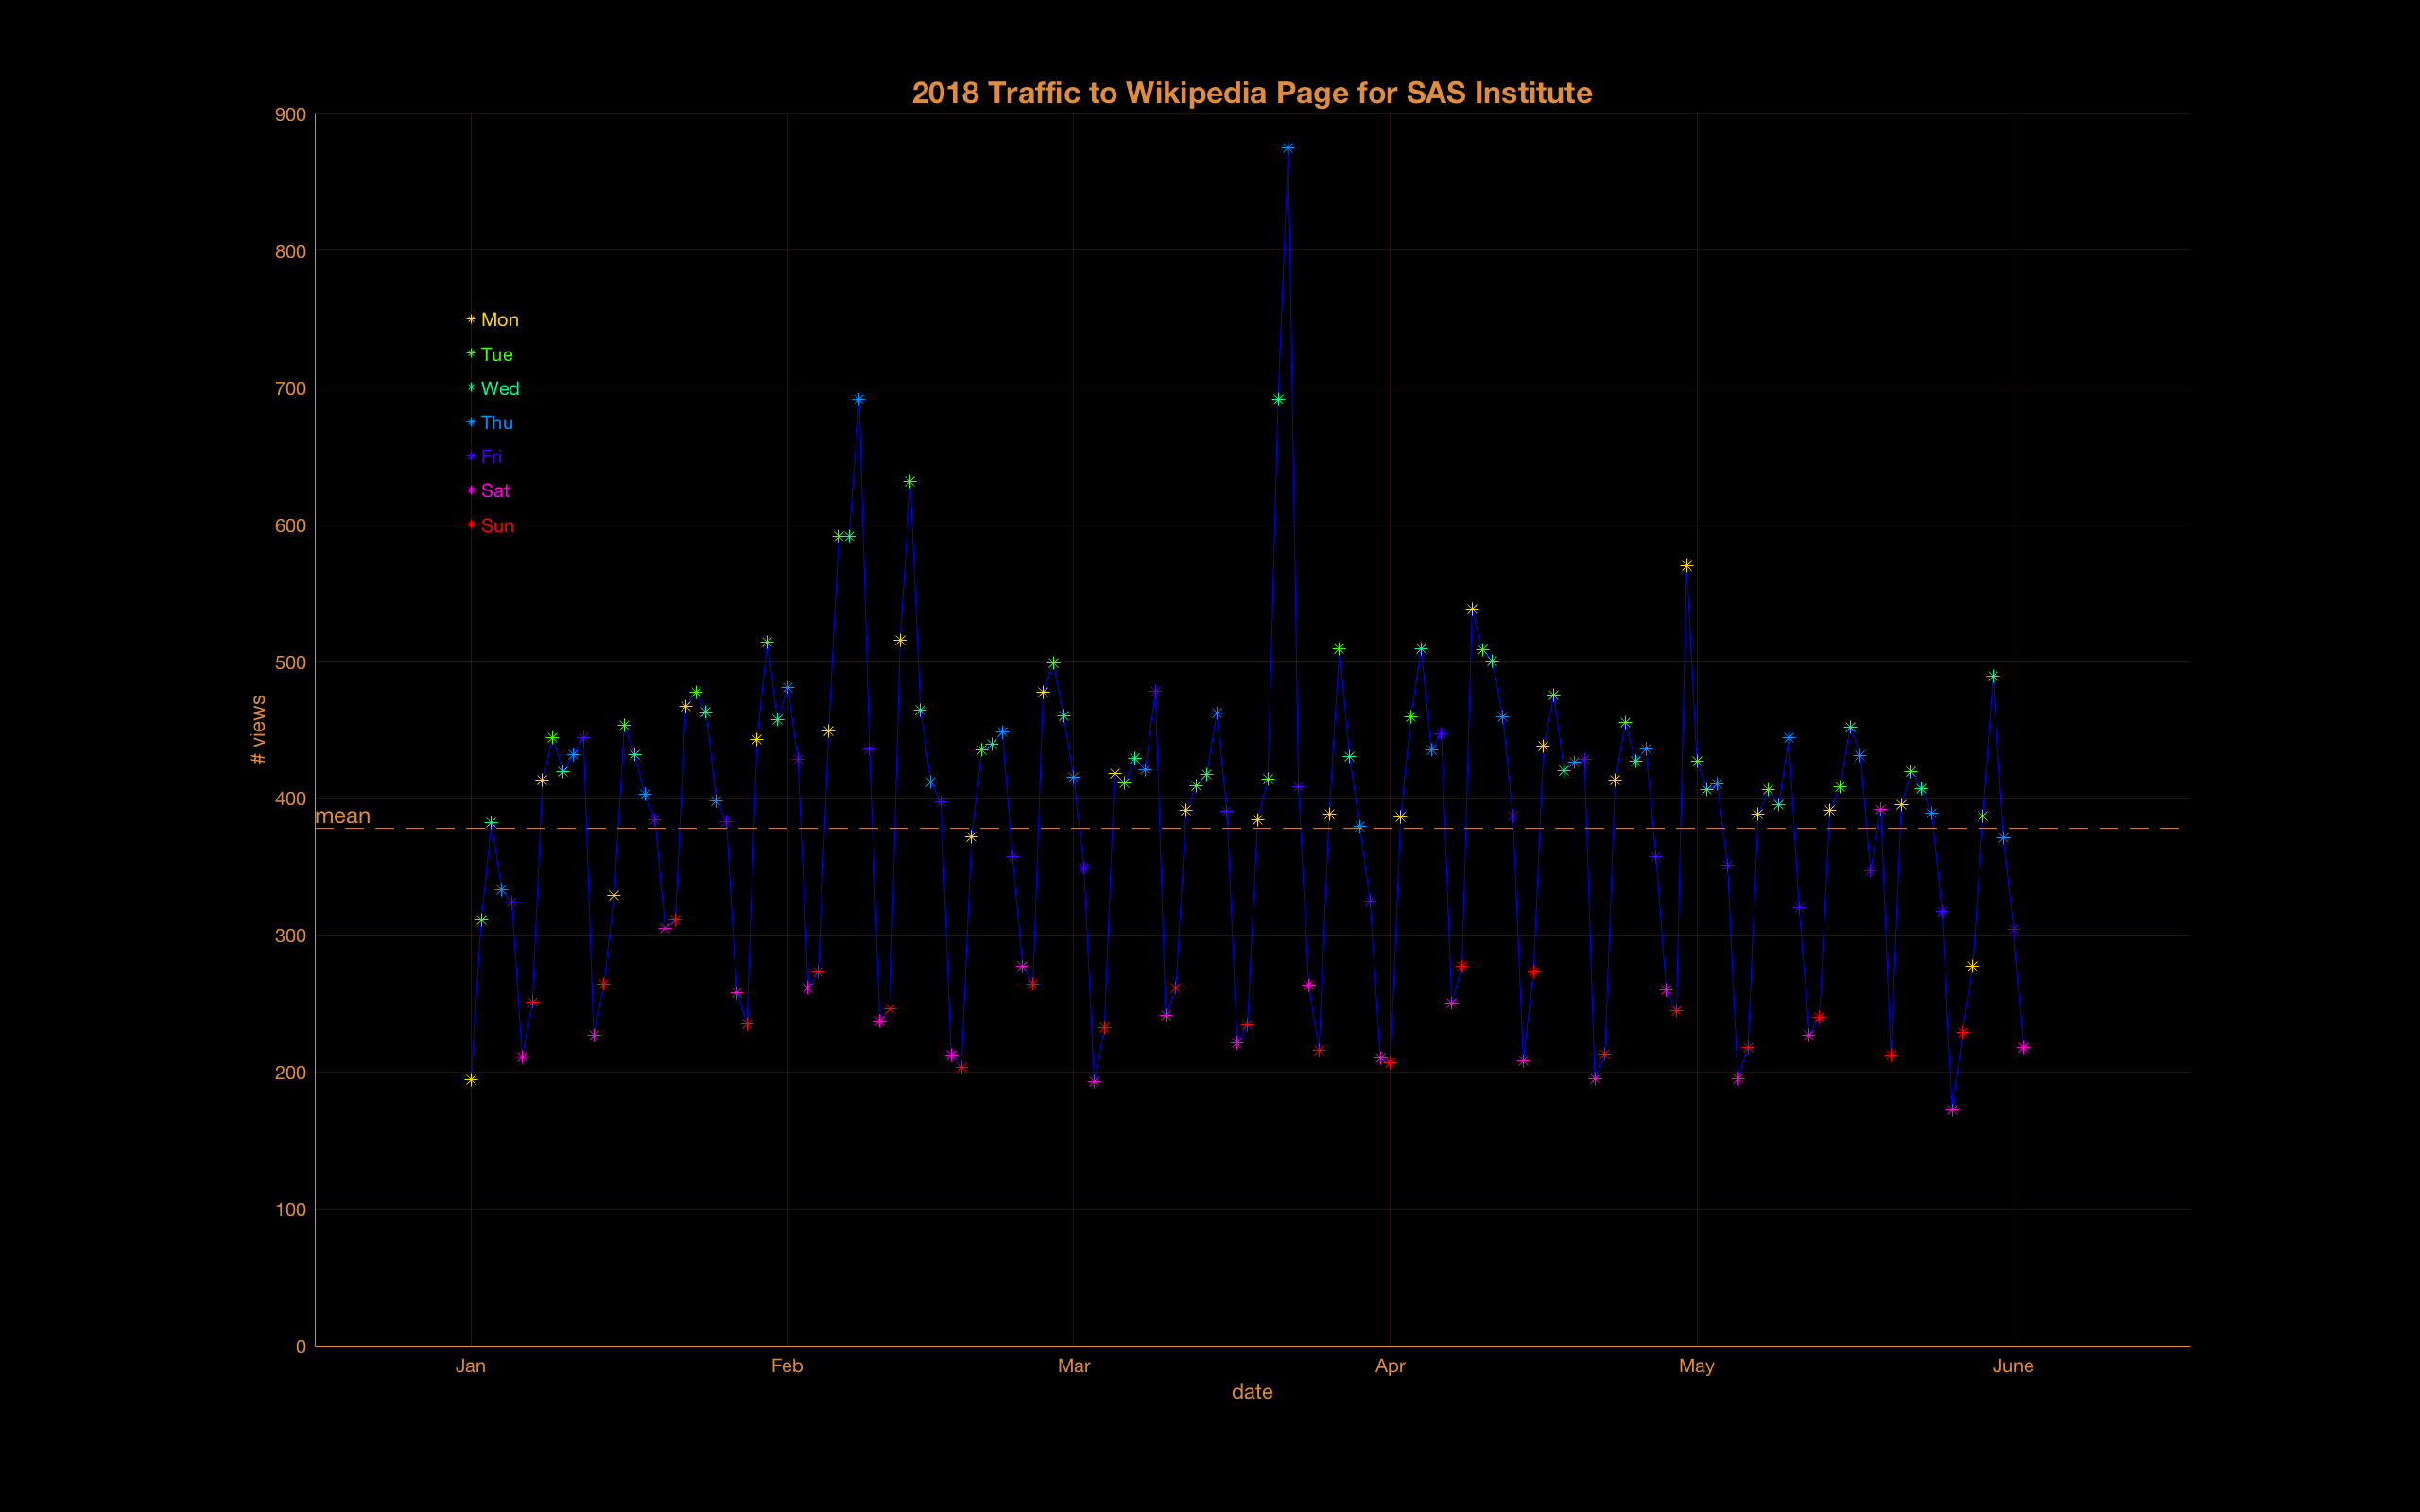
Zooming into the data for 2018, a weekly periodicity is evident.
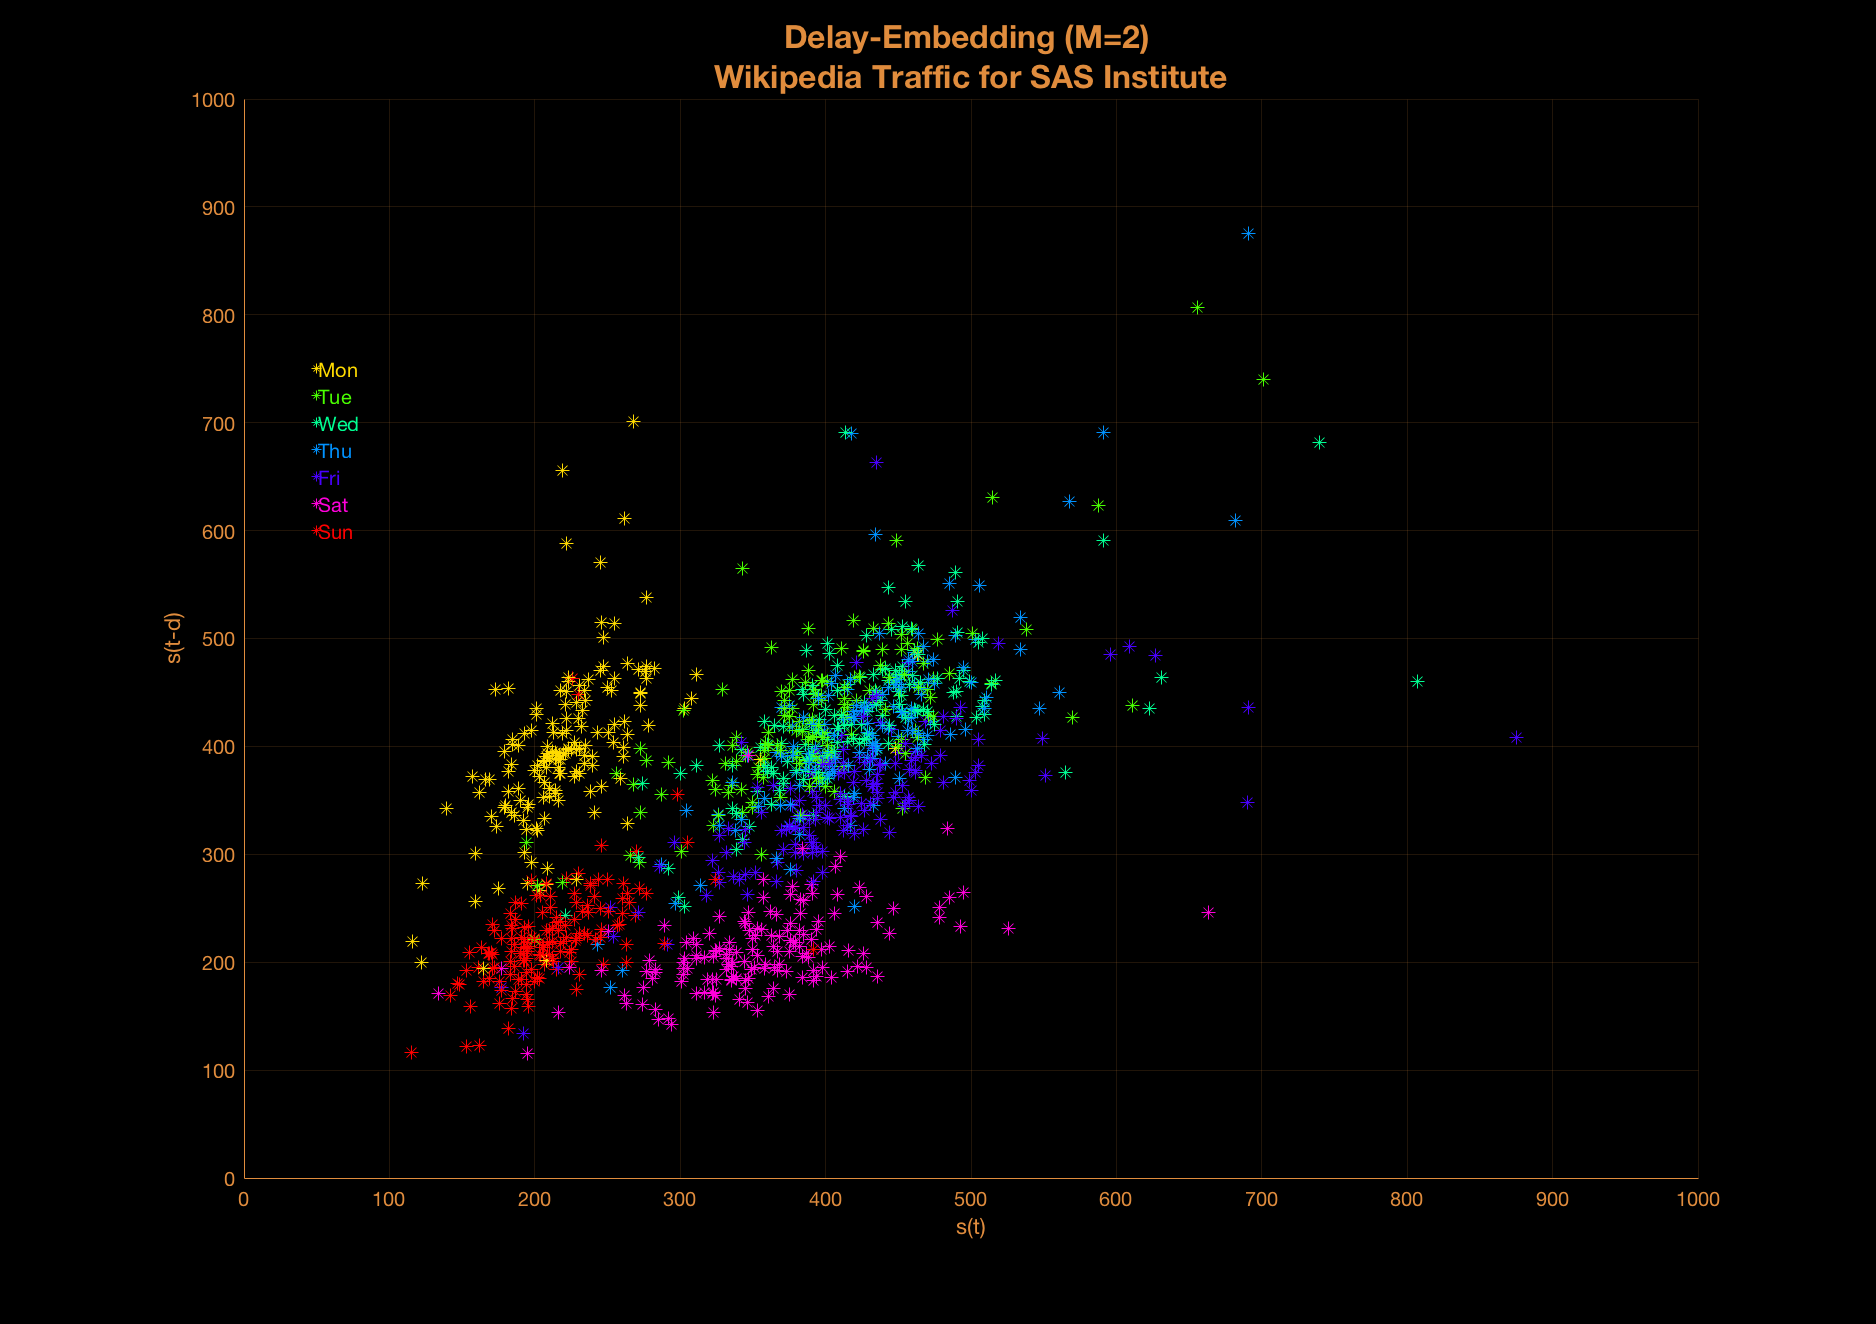
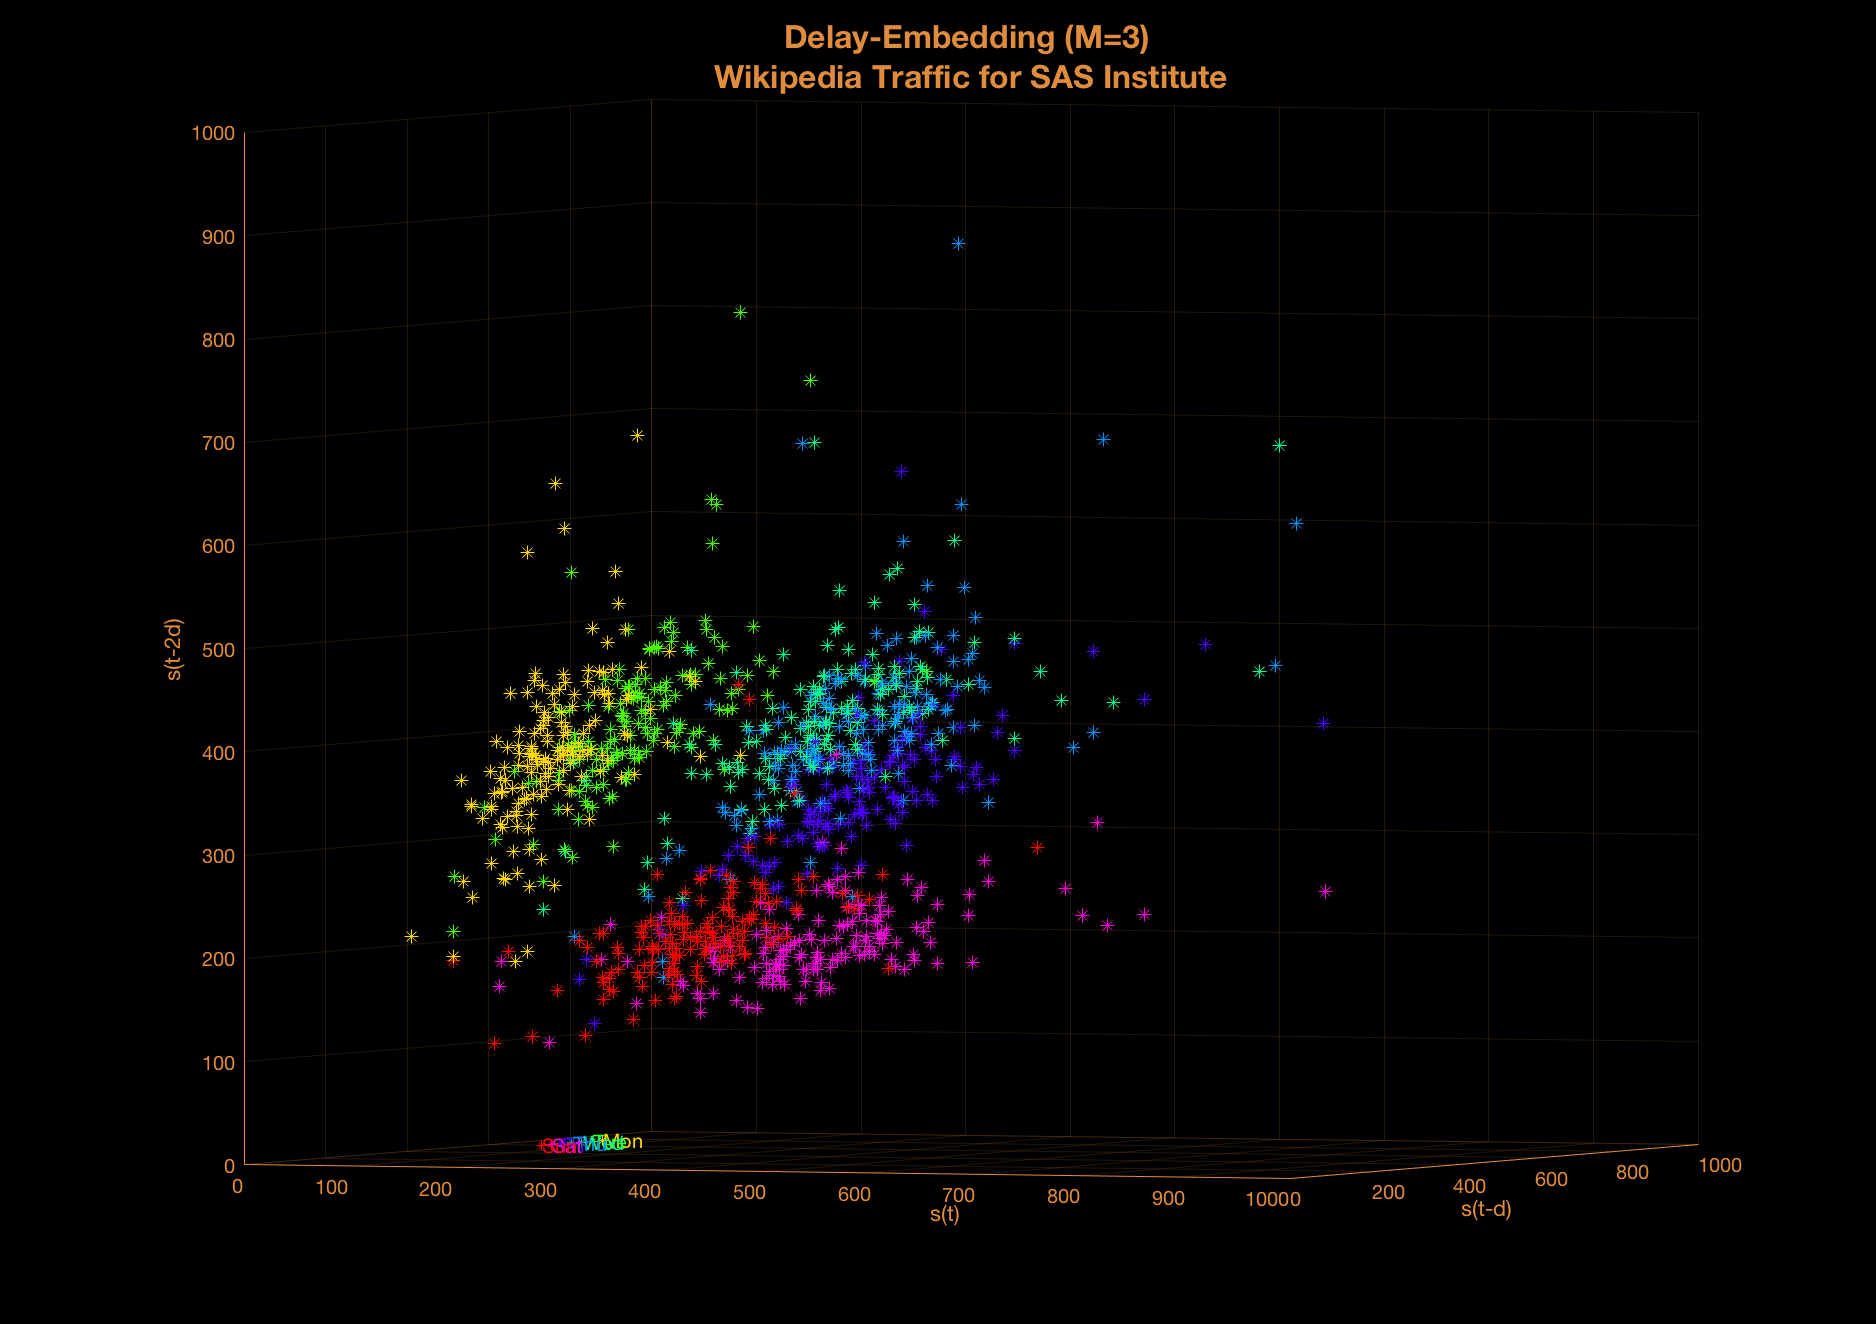
Applying a delay embedding reveals additional geometric structure, especially in higher dimensions.
This is a 3D plot.
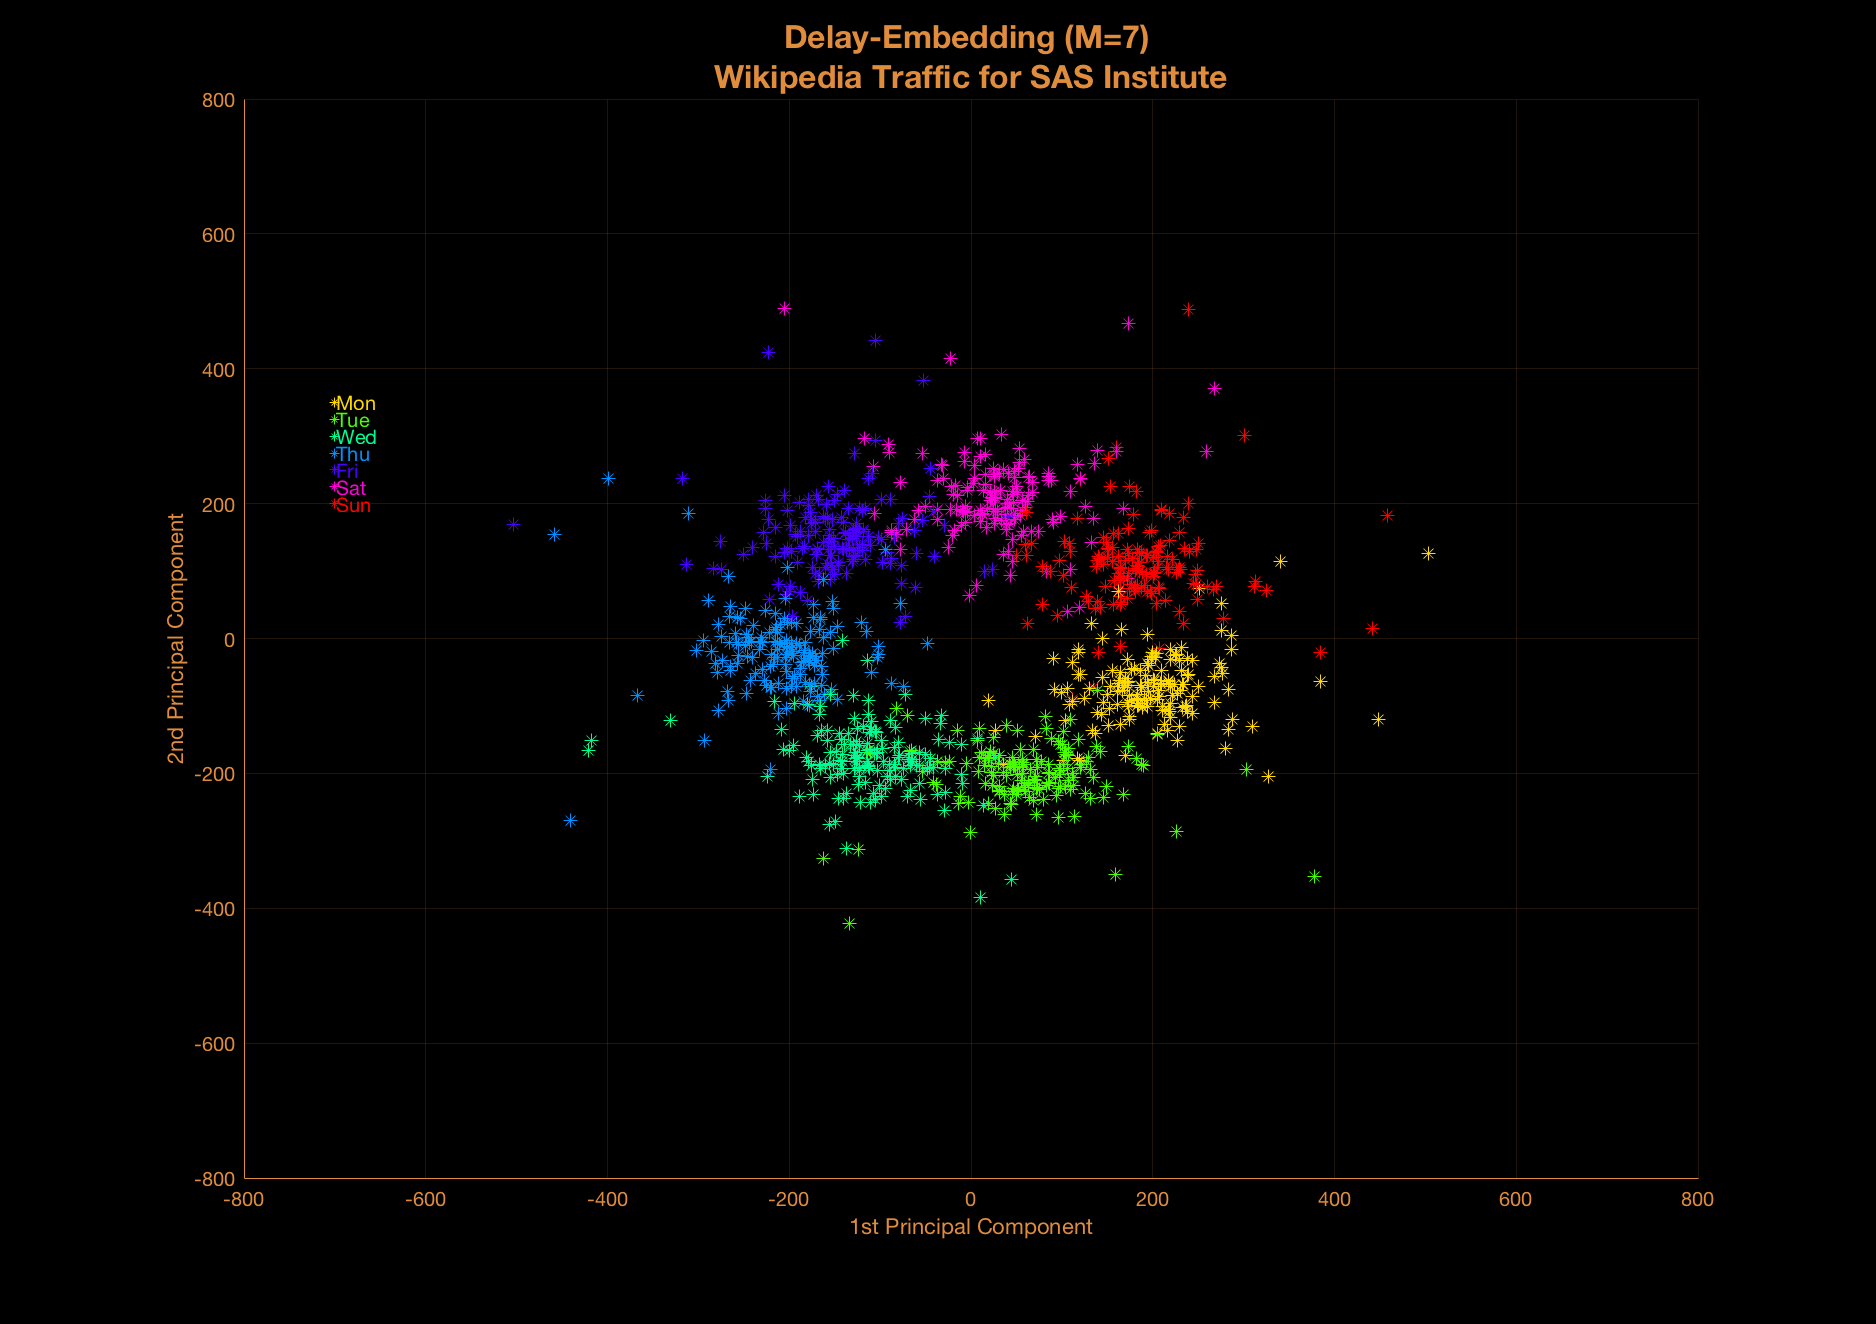
A delay embedding into higher embedding dimension, plotted with a PCA-projection reveals a loop structure,
which corresponds to weekly periodicity
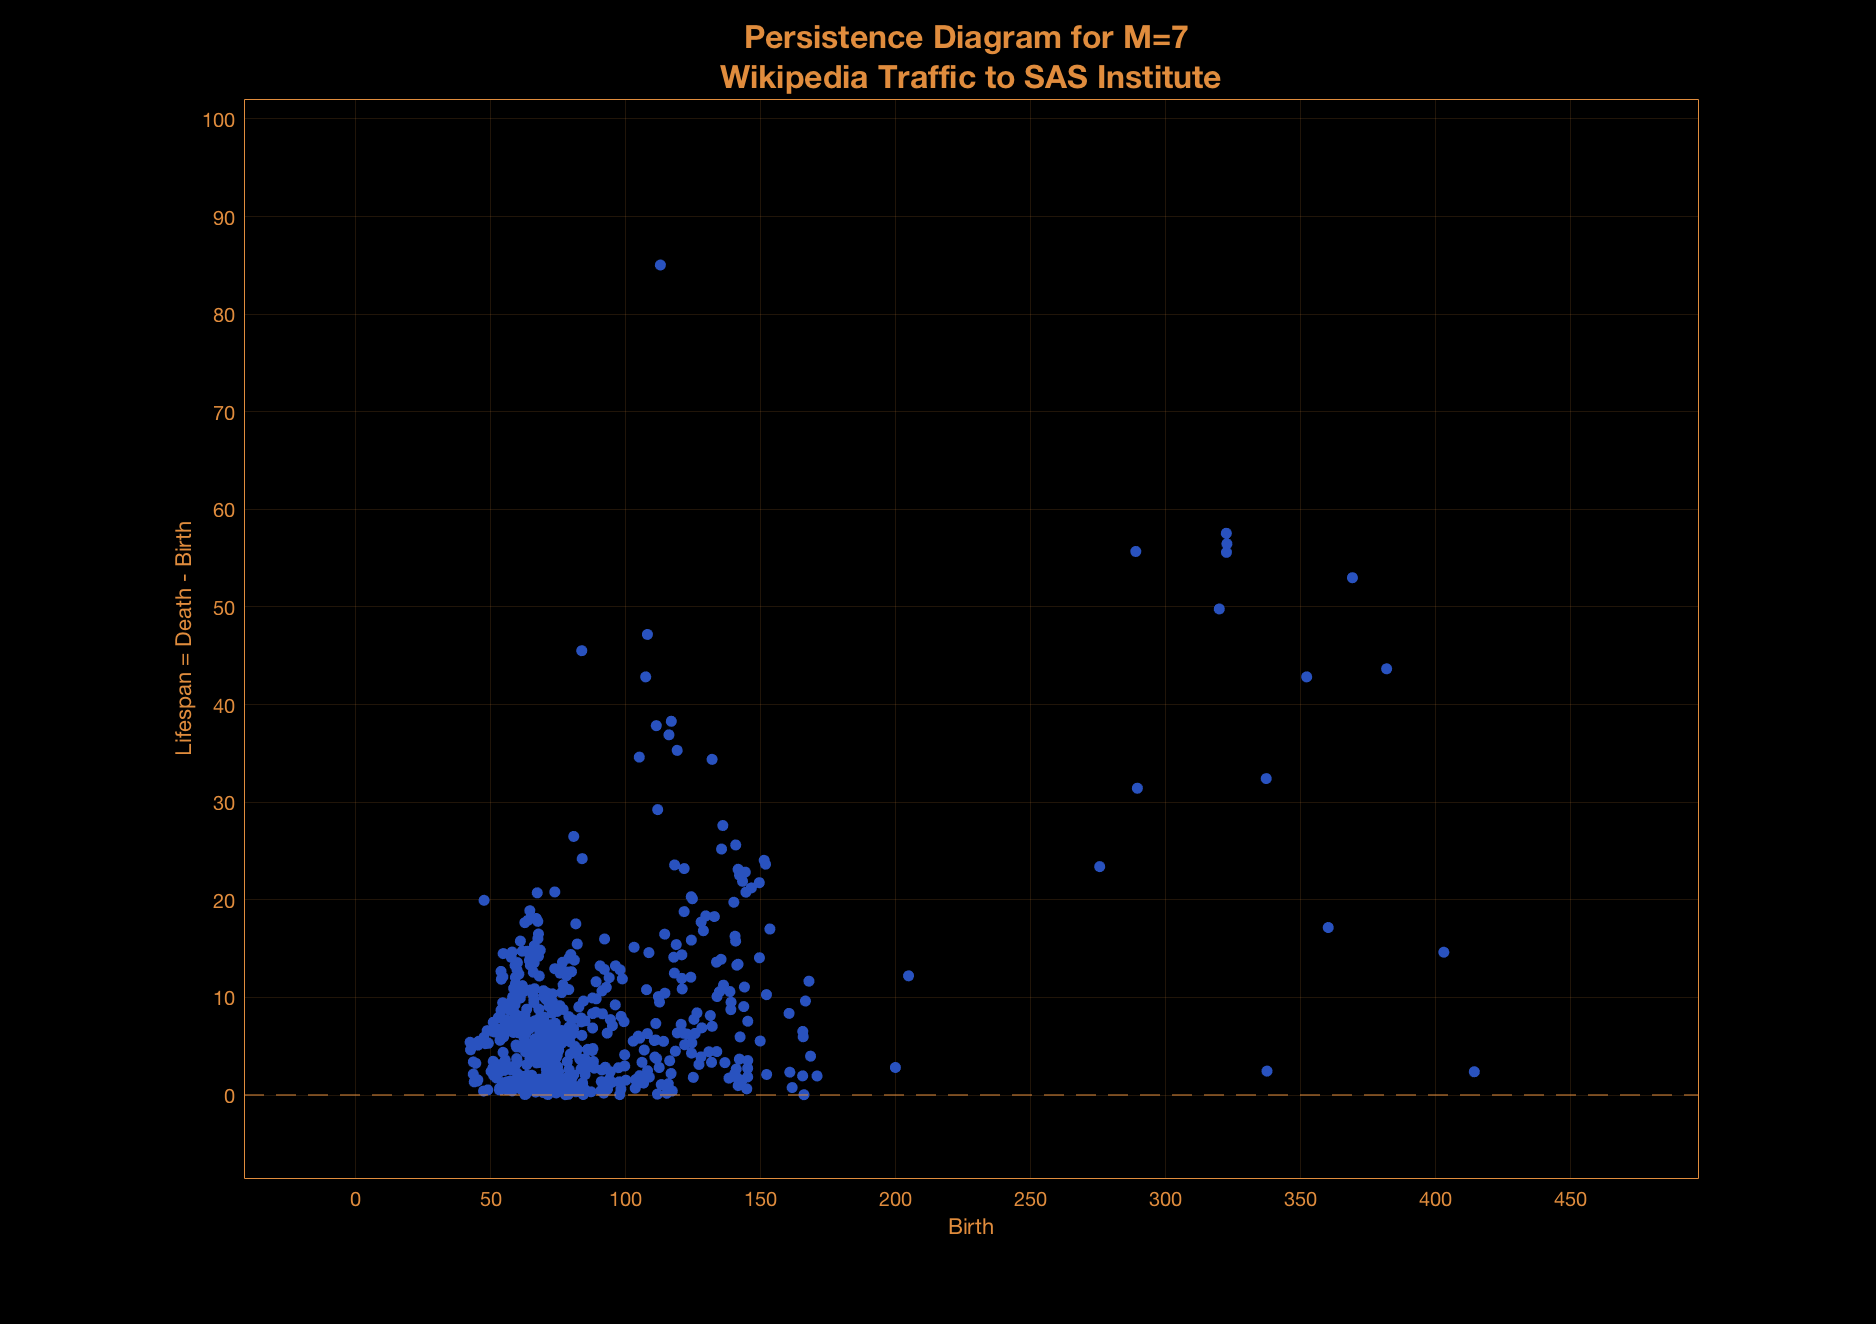
Computing "Persistent Homology" allows us to analyze the shape of the data DIRECTLY in high-dimensional spaces.
The lone "dot" in the upper left, which has an early birth and late death, corresponds to the main loop structure.
The other dots correspond to richer and finer scale structure which can be further analzyed to reveal additional insights.
This is just the beginning of what is possible. For example, further analysis can be performed in a dynamic way to track the evolution of the shape of the time-varying data.